Dense 3D performance
Up to 55× faster rendering in million-point 3D scenes
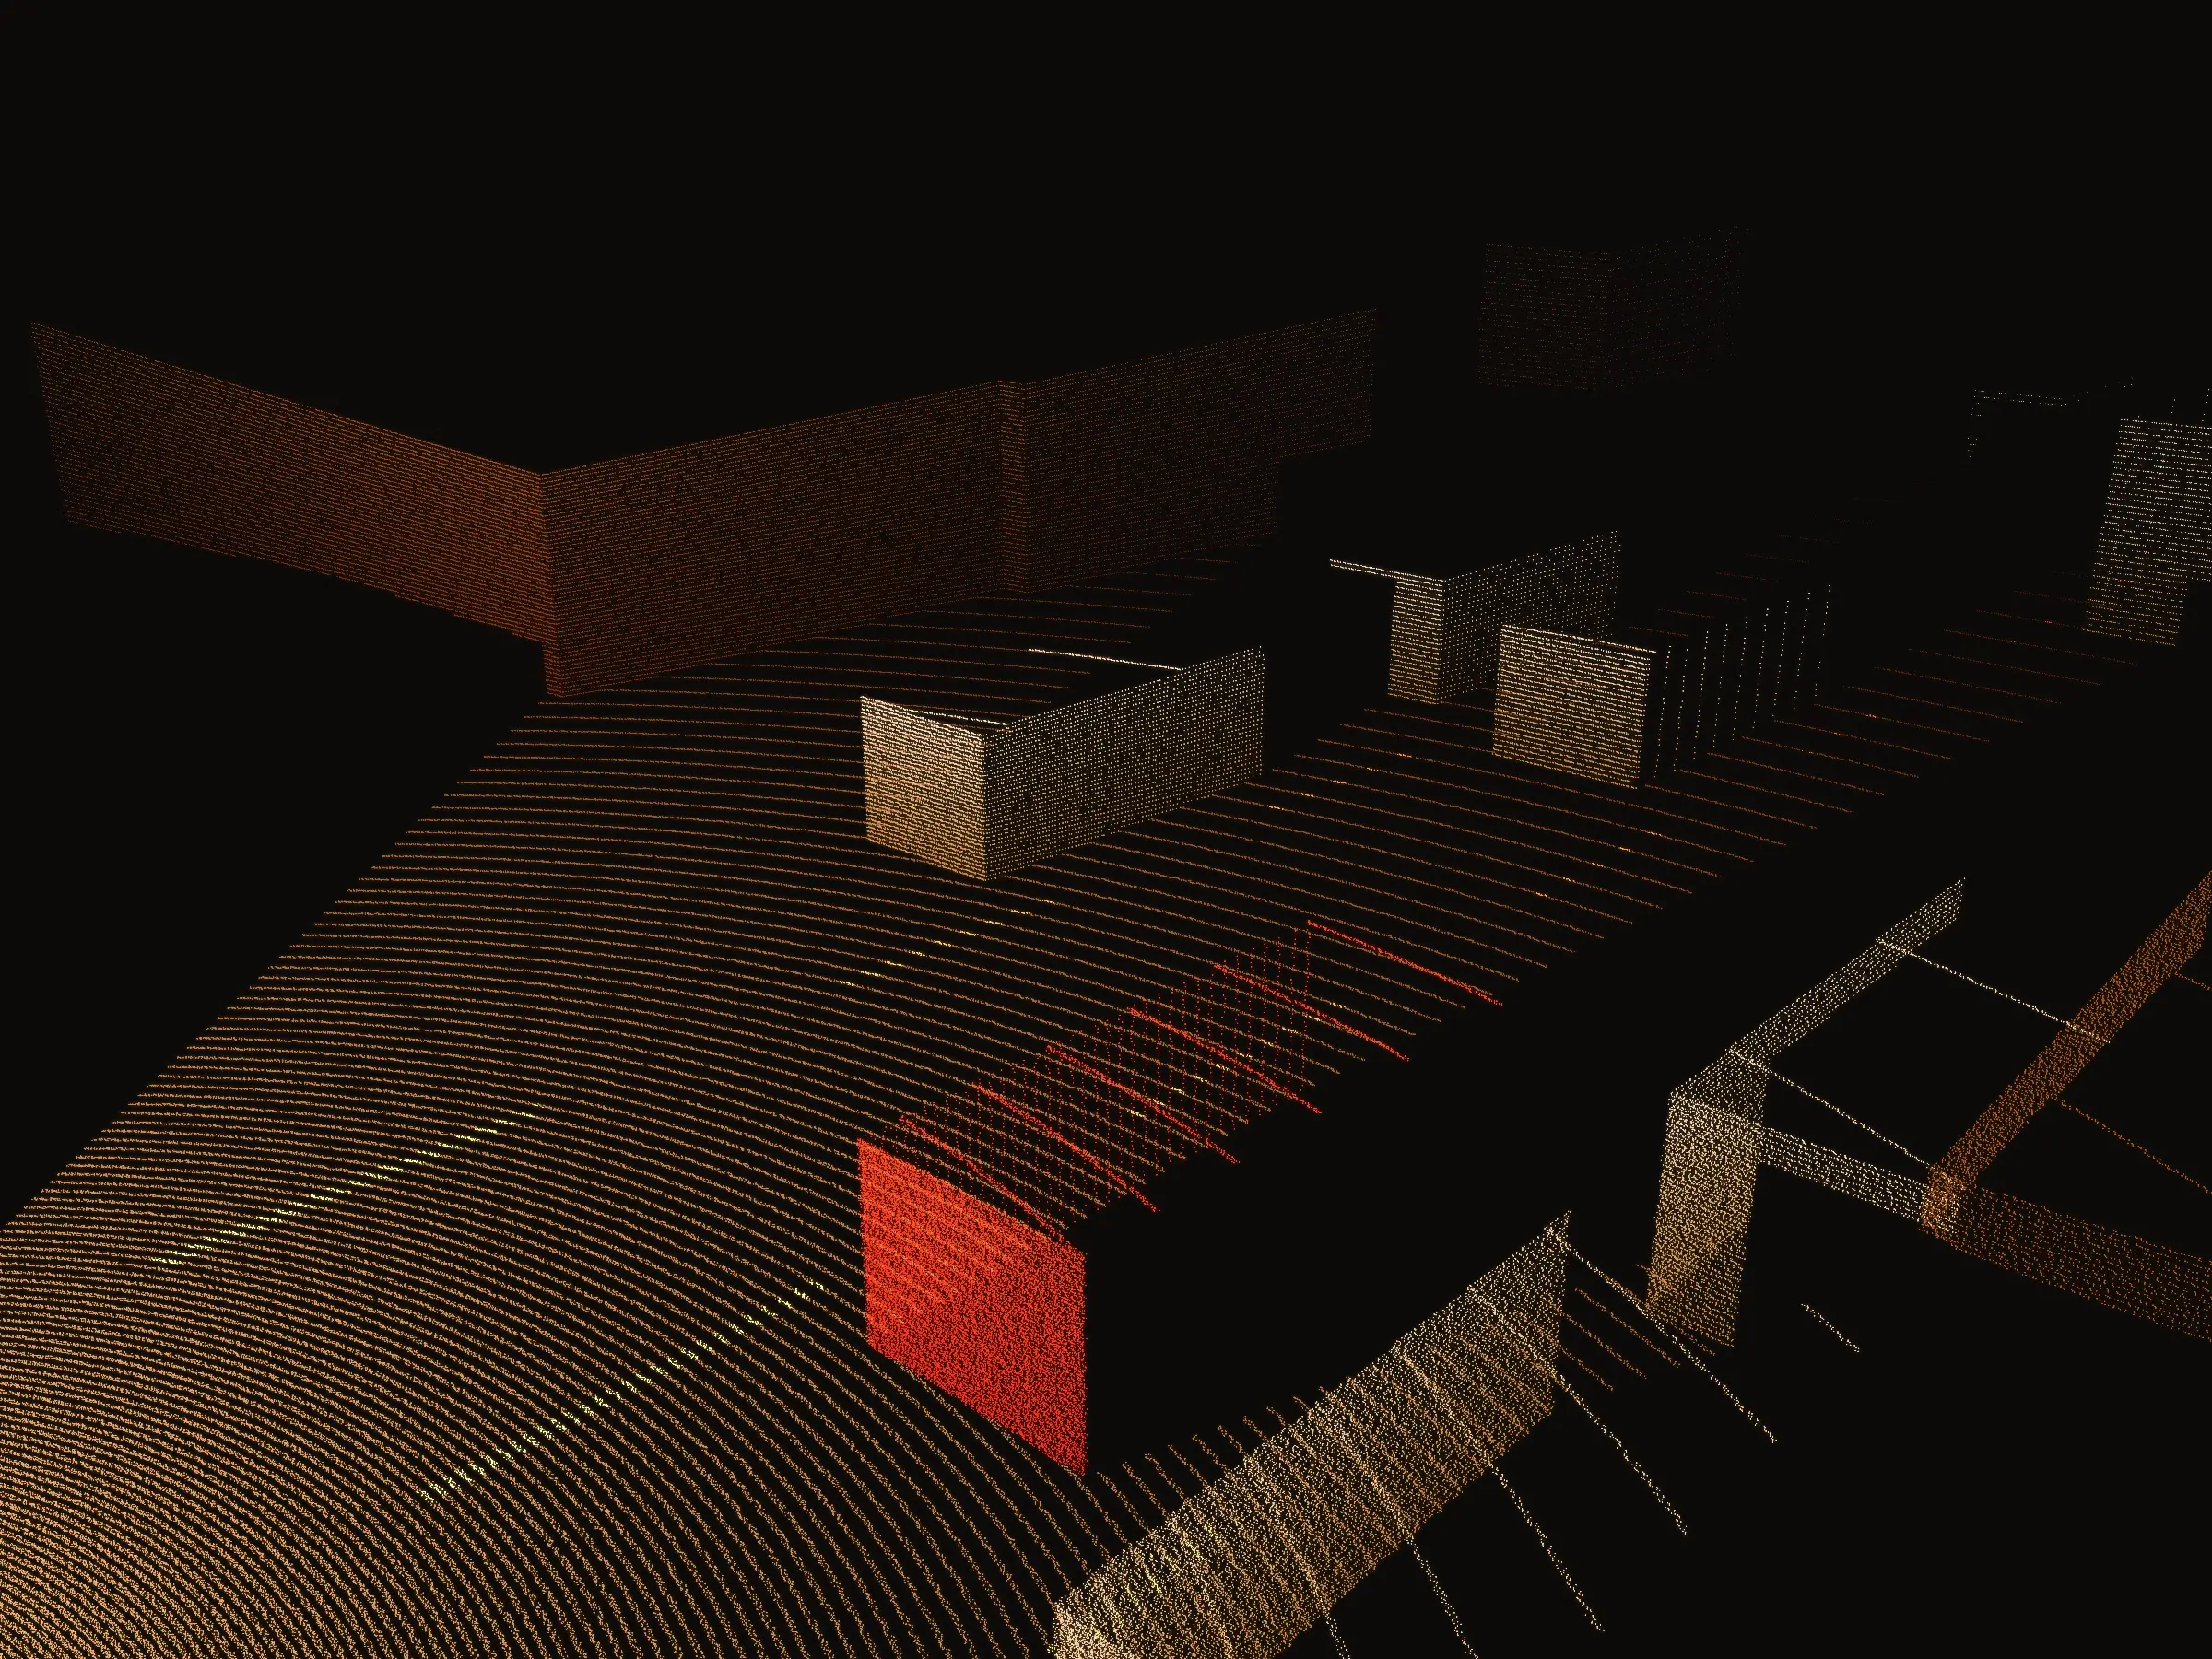
Annotators live inside this editor. They open a lidar dataset — millions of points a frame, hundreds of frames — and draw 3D boxes, paint points into classes and cut 3D polygons through the cloud, frame after frame, for hours. In the densest scenes that work had turned into a fight: the view lagged behind the hand, and long sessions got slower as memory climbed. I owned the investigation and the fixes end to end, and made the editor fast and steady again on the heaviest data it handles.
At a glance
- Where
- The 3D lidar labeling editor, in the browser
- Scene size
- Millions of points a frame, hundreds of frames
- Tools it slowed
- 3D boxes, painting, 3D polygons, label text
- A session
- Hours of continuous labeling, no reload
- Also fixed
- Memory growth and leaks across long sessions
Measured
The problem
Annotation is hand work. A 3D box is placed by eye against the points, a polygon is cut through them, paint is dragged across them — and each one is checked from two or three angles before it is trusted. All of that depends on the view keeping up with the hand, in a browser, on whatever machine the annotator happens to have.
In dense scenes it didn't. Movement didn't feel like smooth 60 FPS: it stuttered and dropped frames, and the labeling tools suffered with it. The scenes that lagged hardest were the crowded ones, which are also the ones with the most to label, so the cost landed exactly where the work was.
Long sessions brought a second problem. Keeping point data around across frames helps performance, but a dataset can run to hundreds of frames with millions of points in each, and memory was paying for it. On top of that were leaks that only appeared after particular sequences of actions, the hardest kind to find — and a tab that has been climbing all afternoon is one nobody wants to still be in at five o'clock.
How I found it
01
Profile the interaction
Record the slow interaction in Chrome DevTools' Performance panel, then drill into individual functions and events to see where the milliseconds go.
02
Snapshot memory in stages
Heap snapshots after load, after some use, and after moving through several frames with interactions, compared for what grew and what stayed referenced.
03
Follow what's retained
Trace retained WebGL objects back to code that shouldn't have been holding them. Those paths only ran under certain conditions, which is why they were so hard to catch.
Result
Panning, zooming, rotating, painting, and box and label-text rendering all got faster. The editor holds that speed through a full day on the largest datasets it takes, and the memory that used to build up over a session no longer does. The pace of the work is set by the person doing it again, not by the scene they opened.